One of the Best JavaScript Spreadsheets with 500+ Excel-Compatible Functions
Deliver true Excel-like spreadsheet experiences, fast - with zero dependencies on Excel. Create financial, budgeting/forecasting, scientific, engineering, healthcare, insurance, and many other similar JavaScript spreadsheet business applications.
Create custom JavaScript spreadsheets, advanced grids, dashboards, reports, and data input forms and much more with the comprehensive API
Leverage the powerful, high-speed calculation engine for your most complex calculations
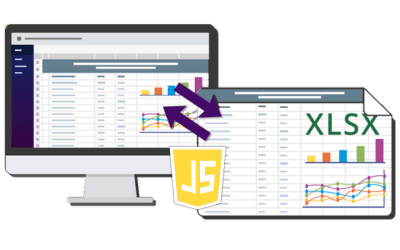
Import and export your most demanding Excel .xlsx spreadsheet
Not sure which products are right for you?
Use our decision tree to find the perfect MESCIUS product for your needs. Answer a few quick questions, and our sales team will follow up with you to guide you through the next steps! Click the button below to open a short questionnaire (hosted on Typeform).
Bring AI to Your JavaScript Spreadsheets Applications. Watch the CodeClinic Live On Demand! Watch Now ≫
Ultimate JavaScript Spreadsheet Solution
High-Performance Spreadsheet Engine
SpreadJS has been designed and optimized from the ground up for fast performance that can handle your most demanding spreadsheet files and datasets. The powerful Calc Engine offers 500+ functions in 19 Languages that includes statistical and financial functions, dynamic arrays and custom user defined functions that are optimized for big data, complex calculations, and advanced Excel models.

Familiar Spreadsheet Experience with Excel IO
SpreadJS delivers a robust JavaScript spreadsheet experience, featuring support for worksheets, row and column headers, a status bar, and more. It includes comprehensive features to provide a complete Microsoft Excel-like experience - even for your Excel power users - including charts, tables, shapes, sparklines, conditional formatting, functions and filtering and so much more. With support for seamless Excel import and export, you can easily integrate your existing spreadsheet data and create and share reports without any dependency on Microsoft Excel.

Complete Document Control
Complete Document Control
SpreadJS offers comprehensive control over your JavaScript spreadsheets, allowing developers to have precise control over what areas of the spreadsheet data - such as cells, rows, columns, sheets and formulas - can be accessed or edited by the user. With the extensive API, you can secure, manage and help eliminate risk such as for Regulatory compliance while keeping the same Excel spreadsheet functionality your users love online but in your controlled and secure environment.
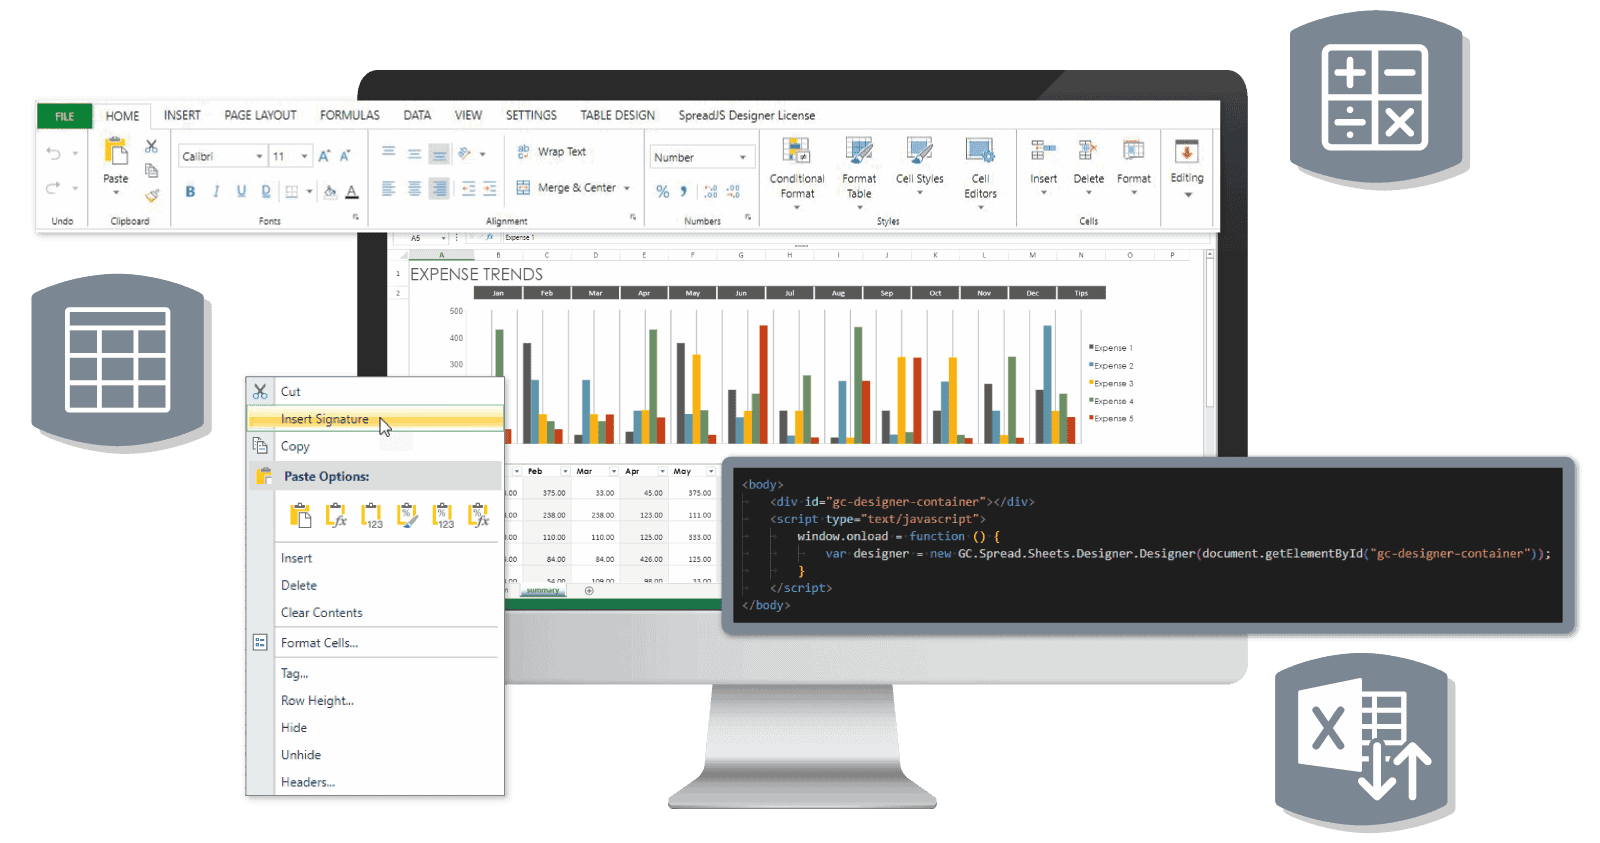
Code-Free JavaScript Spreadsheet Designers
Create and customize spreadsheets without writing a single line of code using the SpreadJS Desktop Designer and optional Designer Ribbon Component add-on. The Desktop Designer provides developers a user-friendly interface for building templates, while the Designer Ribbon Component allows developers to embed a full-featured designer ribbon UI into their applications, complete with a customizable ribbon, formula bar, and status bar. Enable your end-users to easily design, format, and manage complex spreadsheets directly within your web apps.
JavaScript Spreadsheet Features
Import & Export Excel Files
Easily import/export Excel files in JavaScript. Load, modify, and save complex .xlsx files or export data to Excel or a database.
Interactive Forms
Create interactive JavaScript data entry forms with images, cell formatting, formulas, and form controls like buttons, listboxes, and combo boxes for dynamic input.
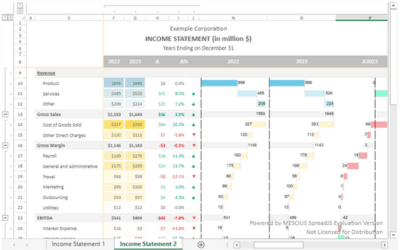
Financial Reports & Analysis
Build JavaScript spreadsheets for financial reports, budgeting, and business apps like Income Statements and Aging Reports for real-time insights.
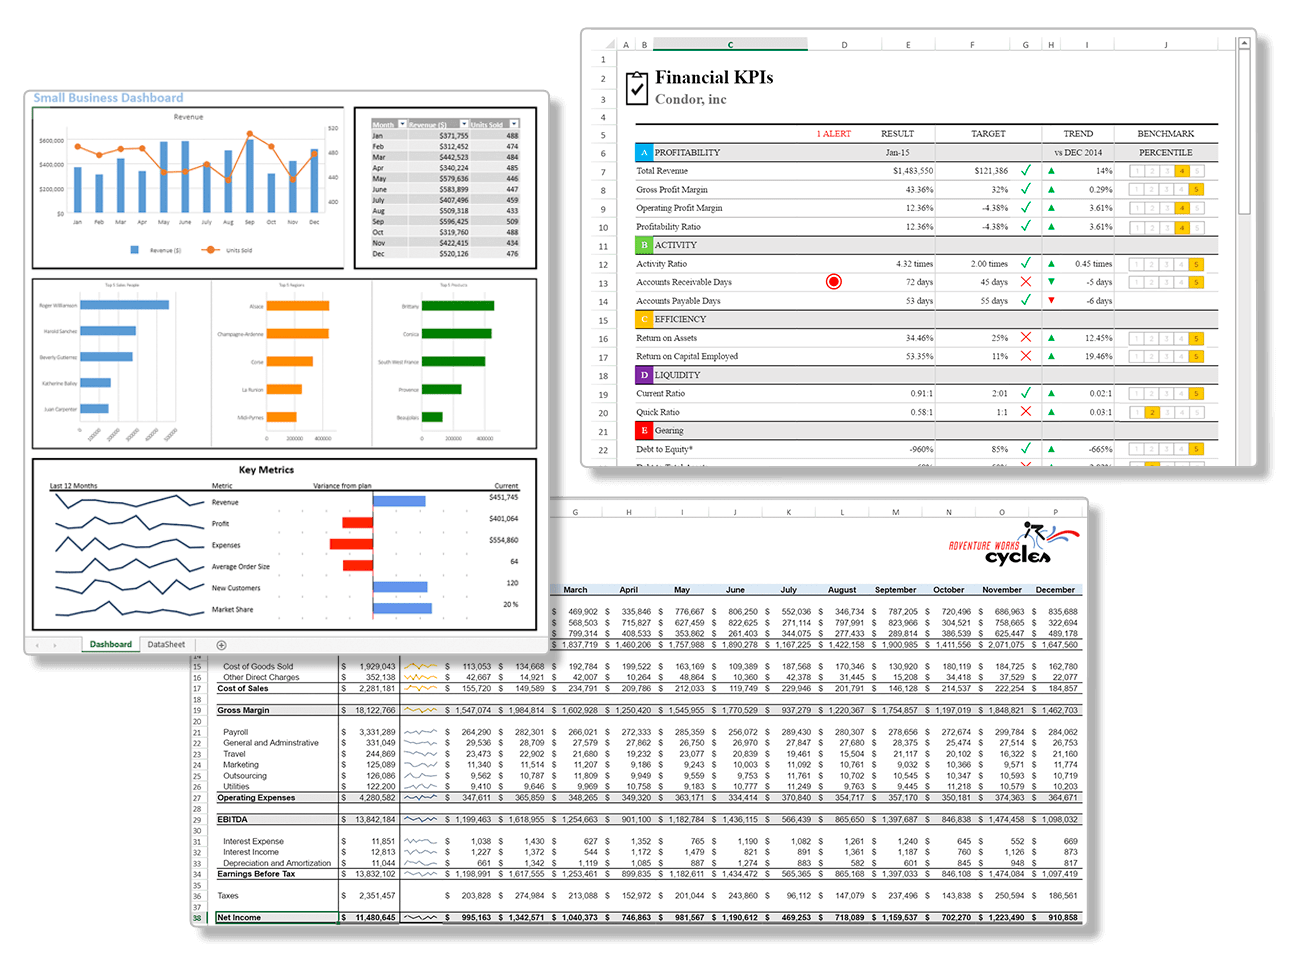
Interactive Dashboards
Build interactive JavaScript dashboards with charts, sparklines, tables, and images—perfect for financial KPIs, project dashboards, gradebooks, and more.

Advanced Data Analysis
SpreadJS provides advanced data analysis with dynamic manipulation, extensive formulas, interactive visualizations, and pivot tables for powerful insights.

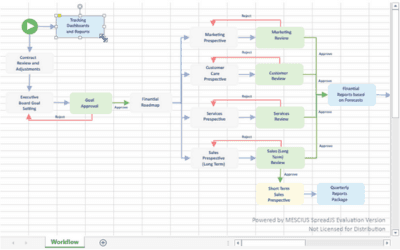
Interactive Diagram Creation
Add interactive flowcharts, spatial layouts, and mind maps to JavaScript apps for clear visualization of complex relationships and data insights.
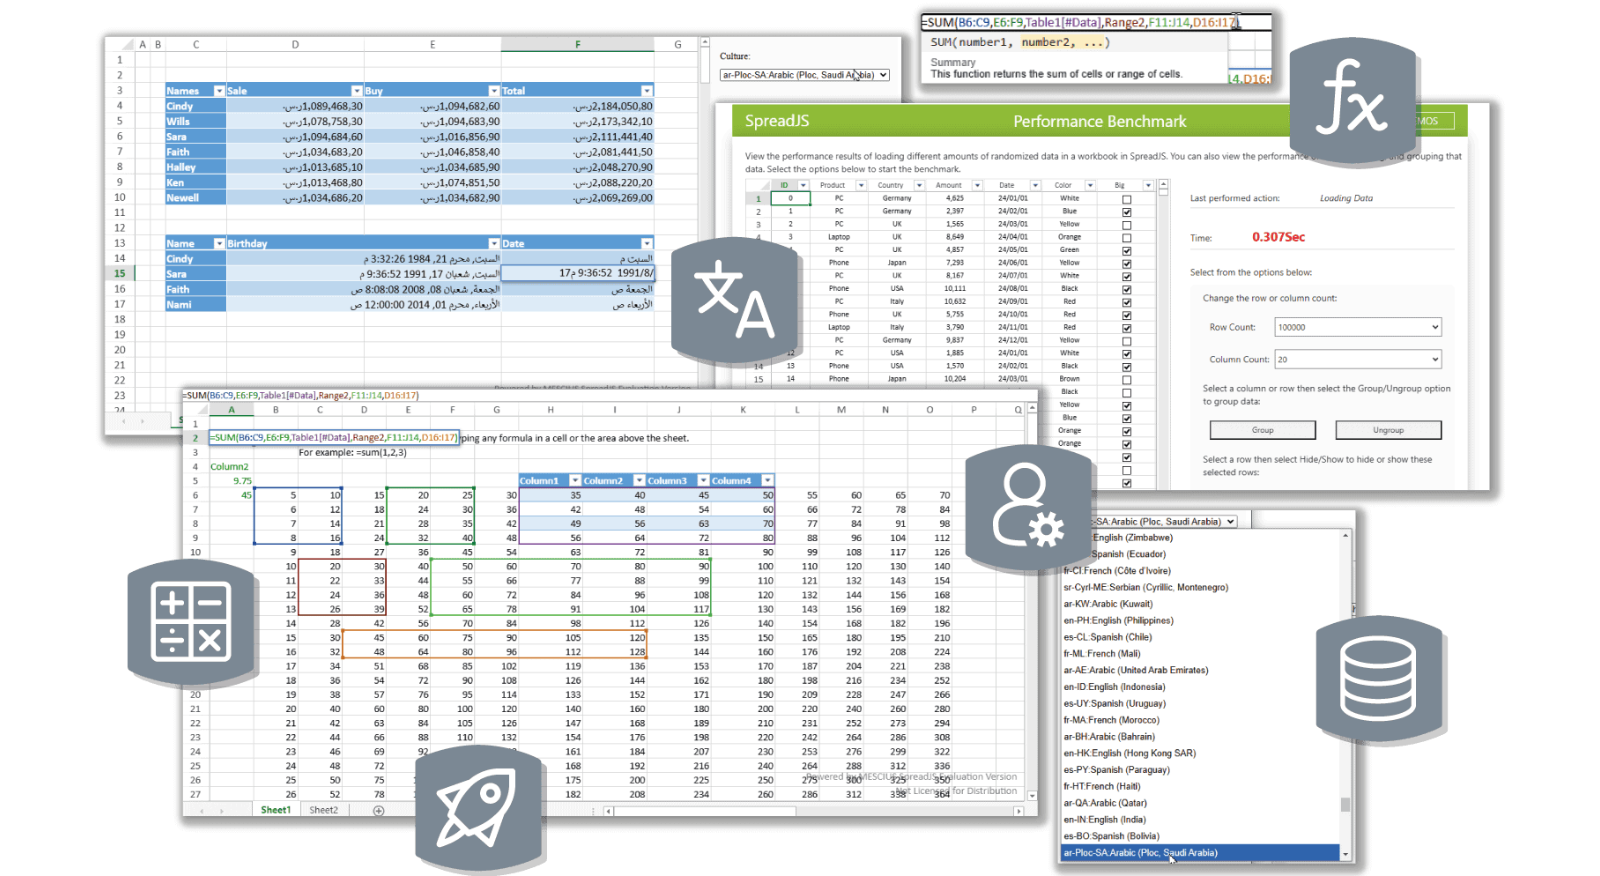
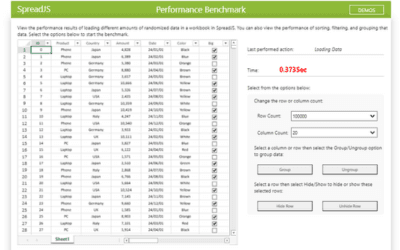
Performance Benchmark
Experience high performance with seamless large dataset handling—our demo loads 2 million cells in under a second and adjusts properties instantly.
Import & Export Excel Files
Comprehensive support for importing and exporting Excel files in JavaScript. Easily load complex .xlsx files into your application using the import method, modify the data or structure, and export it back to Excel or save it to a database using the export method. This process allows for seamless integration of Excel-based data handling in your web applications.
Interactive Forms
Build complex, interactive data entry forms for JavaScript applications. Utilize advanced features like cell formatting, formulas, and a range of form controls—such as buttons, listboxes, combo boxes, and much more—to create dynamic and fully customized input forms. These forms can handle intricate data collection needs, making them ideal for various business applications.
Financial Reports & Analysis
Create powerful JavaScript spreadsheets for financial reporting, budgeting, forecasting, and other business applications. Easily build solutions for Aging Reports, Expense Budgets, Income Statements, Profit and Loss Projections, and more. These spreadsheets are tailor-made for real-time data analysis and decision-making, enabling businesses to gain insights quickly and accurately.
Interactive Dashboards
Create interactive dashboards for your JavaScript applications with built-in charts, sparklines, tables, images, and more. These dashboards are perfect for tracking financial KPIs, project management, gradebooks, medical data, and various other business applications. Easily visualize key metrics and insights, making them ideal for real-time decision-making and performance monitoring.
Advanced Data Analysis
SpreadJS provides advanced data analysis capabilities, enabling dynamic data manipulation, extensive formula support, interactive visualizations, and optional pivot tables for generating powerful insights. It allows users to perform complex calculations, analyze large datasets, and create visually engaging reports—all within a JavaScript environment. Perfect for applications that demand high-performance data processing and analysis.
Interactive Diagram Creation
Enable interactive flowcharts, spatial layout visualization, and mind mapping in your JavaScript applications with SpreadJS’s robust shapes support. Use built-in shapes and connectors to visualize complex relationships and enhance data presentation. These features allow you to easily create workflows, organizational charts, or intricate data connections, improving communication and understanding of complex concepts. Ideal for business processes, project management, and educational tools.
Performance Benchmark
SpreadJS delivers exceptional performance, effortlessly handling large datasets. It can populate 2 million cells in under a second while allowing quick adjustments to properties, ensuring smooth user interactions even with extensive data. With SpreadJS, your applications can efficiently manage high-volume data, making it ideal for enterprise-level reporting, analysis, and data-driven decision-making.
Import & Export CSV Files
Easily import/export Excel files in JavaScript. Load, modify, and save complex .xlsx files or export data to Excel or a database.
Import & Export the Optimized SJS Files
SpreadJS uses its .sjs file format to save and load spreadsheets, preserving all features, styles, and data for fully functional sharing within applications.

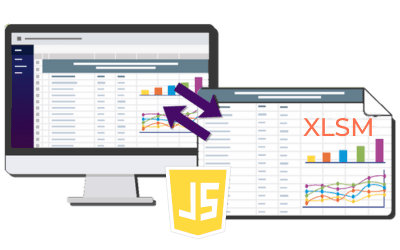
Import & Export XLSM Files
Import and export Excel Macro-Enabled Workbooks (.xlsm) in SpreadJS. Macros are preserved for Excel but cannot run in SpreadJS.
Import & Export XLTM Files
Import and export Excel Macro-Enabled Templates (.xltm) in SpreadJS. Macros are preserved for Excel but cannot run in SpreadJS.

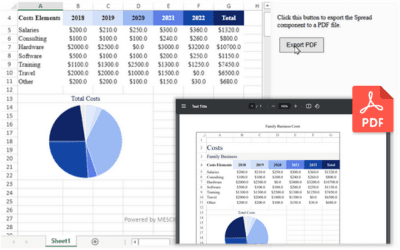
Exporting to PDF
Use savePDF method for direct PDF export in your JavaScript spreadsheet app, converting .xlsx files with options for margins, headers, footers, and orientation.
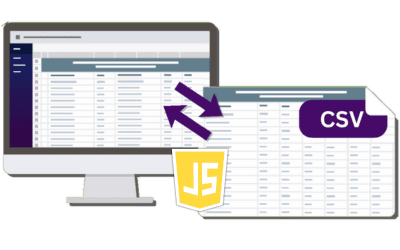
Import & Export CSV Files
Enables seamless .csv import/export for efficient data exchange with other applications.
Export Charts to Images
Export Charts to ImagesExport JavaScript charts as images in popular formats like PNG or JPEG, making it easy to share or embed high-quality visuals in reports, presentations, or websites.

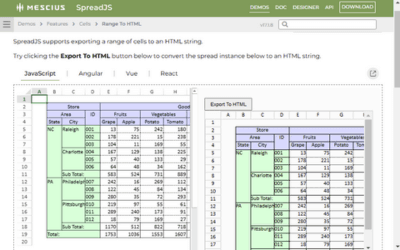
Export Spreadsheet Range to HTML
Export Spreadsheet Range to HTMLConvert cell ranges or sheets to HTML with the toHTML method, including styles, gridlines, and headers for easy web integration.
Import & Export Excel Files
Comprehensive support for importing and exporting Excel files in JavaScript. Easily load complex .xlsx files into your application using the import method, modify the data or structure, and export it back to Excel or save it to a database using the export method. This process allows for seamless integration of Excel-based data handling in your web applications.
Import & Export Optimized SJS Files
SpreadJS uses its proprietary optimized .sjs file format to save and load spreadsheets, ensuring that all features, styles, and data are fully preserved for seamless sharing within applications. Using the workbooks open and save methods, users can easily import and export .sjs files, retaining complex formatting, formulas, and interactive elements. This enables consistent, fully functional file sharing, ideal for collaborative and data-driven JavaScript applications.
Import & Export XLSM Files
SpreadJS supports lossless import and export of Excel Macro-Enabled Workbook (.xlsm) files, keeping all embedded VBA macros intact for use in Microsoft Excel. While macros remain in the file, SpreadJS does not support, execute, or display macro code. Users can open, edit, and save .xlsm files without breaking macro functionality in Excel. Exporting to non-macro formats like .xlsx or .ssjson will remove macros. Due to Excel’s security model, users may be prompted to enable macros when opening these files in Excel.
Import & Export XLTM Files
SpreadJS enables seamless import and export of Excel Macro-Enabled Template (.xltm) files, retaining all embedded VBA macros for use in Microsoft Excel. However, macros are not supported, executed, or editable in SpreadJS. This ensures that Excel can still run the macros after saving from SpreadJS. Exporting to other formats such as .xlsx or .sjs will remove all macro content. When reopening these files in Excel, users may need to manually enable macros due to Excel’s security settings.
Exporting to PDF
SpreadJS enables direct PDF export from JavaScript spreadsheet applications with the savePDF method, allowing users to convert imported Excel (.xlsx) files into high-quality PDFs. Customize your PDF exports using the printInfo object to adjust settings like margins, headers, footers, and orientation, providing precise control over the final output. This feature is perfect for generating professional, print-ready reports and documents directly from your JavaScript applications.
Import & Export CSV Files
SpreadJS makes it easy to import and export of .csv files, streamlining data exchange between your spreadsheet and other applications. Use the setCsv method to load data from a comma-separated file directly into your spreadsheet, and the getCsv method to export it back. This efficient handling makes it simple to integrate, manipulate, and share data, ideal for applications requiring flexible data management.
Export Charts to Images
Export JavaScript charts as images in popular formats like PNG or JPEG, making it easy to share or embed high-quality visuals in reports, presentations, or websites. Use the chart classes toImageSrc method to convert your charts into image files, ensuring crisp, clear visuals that enhance data presentation and provide flexibility for sharing insights across various platforms.
Create business reports for your JavaScript applications, such as Accounts Receivable reports, Expense Budgets, Income Statements, and Inventory trackers. You can then use the toHTML method of the CellRange class to export relevant data ranges to HTML, enabling easy integration into other web applications for seamless viewing and sharing of report data.
Advanced Calculations
Supports over 500 built-in functions for comprehensive data analysis.

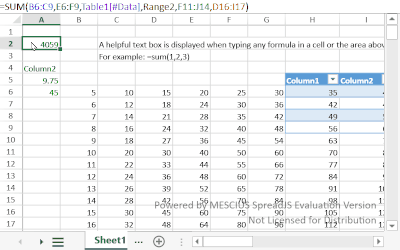
Create Formula Text Boxes
Create Formula Text BoxesEnable users to view, edit, and create formulas with a formula text box, including a range selector button for easy cell referencing.
Formula Editor Panel
Formula Editor PanelSimplify complex formulas with SpreadJS's Formula Editor—collapsible views, syntax highlighting, and tooltips for easy editing and debugging.
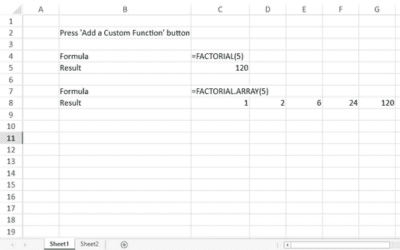
Custom Functions
Custom FunctionsEasily create and integrate custom functions tailored to your specific needs.
Dynamic & Spilled Arrays
Dynamic & Spilled ArraysNative support for dynamic arrays, allowing for flexible, real-time data calculations.

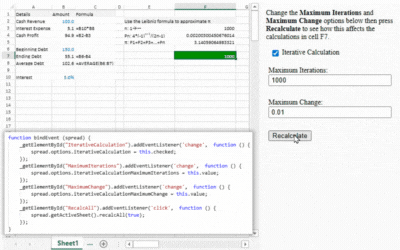
Iterative Calculations
Iterative CalculationsHelp solve problems by reusing previous results. The CalcEngine.goalSeek function enables what-if analysis and future value calculations for investments.
Formula Auditing
Formula AuditingExtensive tools for tracing dependencies, precedents, and evaluating formula logic.

Array Formulas
Array FormulasArray formulas, often referred to as CSE (Ctrl+Shift+Enter) formulas, accept array arguments and return array values.

Table Formulas
Table FormulasSpreadJS supports total row formulas in tables, allowing users to quickly select and insert summary functions from a dropdown list.

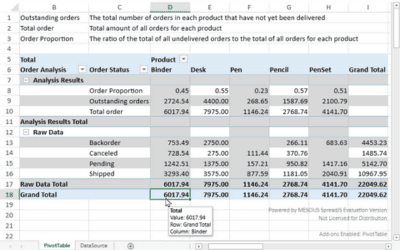
Pivot Calculated Items (Optional Add-On)
Pivot Calculated Items (Optional Add-On)The SpreadJS' Pivot Table Add-on lets users add custom calculated items in rows/columns, using formulas with constants or other pivot items.
Advanced Calculations
SpreadJS supports over 500 built-in functions, providing a comprehensive engine for data analysis and complex calculations in JavaScript applications. Easily input functions like SUM or leverage the setFormula method to apply formulas directly to cells, enabling powerful data processing and precise analysis. This flexibility, combined with SpreadJS’s extensive function library, makes it ideal for handling intricate data requirements.
Create Formula Text Boxes
Enhance your application by allowing users to view, edit, and create formulas directly in a formula text box. With SpreadJS, users can easily input formulas and use the range selector button to select cell ranges for referencing, streamlining formula creation and editing. This feature provides a user-friendly interface for managing calculations, making it easier to interact with complex formulas within workbooks.
Formula Editor Panel
Streamline the creation and editing of complex formulas with SpreadJS's Formula Editor Panel. This feature provides a user-friendly interface with collapsible views, syntax highlighting, and tooltip support, making it easy to edit, debug, and understand intricate formulas. Designed for efficiency, the panel simplifies formula management for users at all experience levels.
Custom Functions
Easily create and integrate custom functions, tailoring calculations to meet your specific application needs. Define unique formulas and implement them seamlessly alongside built-in functions, giving you the flexibility to handle specialized data analysis and processing. Custom functions can be added directly to your spreadsheet, enhancing its capability to address complex business requirements.
Dynamic & Spilled Arrays
SpreadJS offers dynamic array support as an enhancement over traditional array formulas. Dynamic array formulas can return multiple results, automatically adjusting to accommodate these values without requiring manual adjustments. Formulas that yield multiple results are termed "spilled array formulas," enabling a more flexible, responsive calculation experience in your applications. This functionality is ideal for scenarios involving extensive data sets or complex calculations requiring real-time updates.
Iterative Calculations
Incremental calculations allow users to reuse previous results and refine outcomes through repeated recalculations. To enable this functionality in SpreadJS, set the iterativeCalculation property to true, allowing adjustments to continue until a specific target is met—ideal for complex financial models and forecasting scenarios. You can also perform what-if analysis with the CalcEngine.goalSeek function, which uses iterative calculations in SpreadJS to determine the necessary input for achieving desired results.
Formula Auditing
SpreadJS provides extensive support for formula auditing, enabling users to analyze relationships between formulas and cells within a worksheet. Using the getDependents and getPrecedents methods, you can trace dependent and precedent cells, visually displaying connections to help troubleshoot and understand complex calculations. This functionality is invaluable for auditing large or intricate spreadsheets, ensuring accuracy and transparency in data handling.
Array Formulas
Array formulas, commonly known as CSE (Ctrl+Shift+Enter) formulas, allow you to work with multiple values simultaneously by accepting array arguments and returning array results. In SpreadJS, you can apply array formulas using the setArrayFormula method, which enables complex, multi-cell calculations that update dynamically across specified ranges. This feature is ideal for handling advanced data analysis and manipulation within spreadsheets.
Table Formulas
SpreadJS supports total row formulas in tables, allowing users to quickly add summary functions to their data. With an intuitive dropdown list, users can select and insert the desired calculation—such as SUM, AVERAGE, or COUNT—directly into the total row. Additionally, the setColumnDataFormula and setColumnFormula methods enable users to apply formulas across entire table columns, simplifying column-wide calculations and enhancing data analysis capabilities.
Pivot Calculated Items
The optional Pivot Table Add-on enables users to add custom calculated items within row or column fields, enhancing data analysis capabilities. Using the addCalcItem method in the PivotTable class, users can create formulas that include constants or references to other pivot table items, allowing for tailored calculations directly within the JavaScript pivot table. This feature is ideal for creating more dynamic and customized data summaries.
Cell Types
Various cell types allow you to define the information entered and displayed in any cell, or use predefined dropdowns for easier data selection and validation.

Cell Drop-Downs
Effortlessly choose data with cell drop-downs. Create interactive forms with lists, date pickers, sliders, calculators, and color pickers.

Range Templates
The Range cell type allows custom rendering of data using a template, enabling views like card layouts, multi-rows, or KPI blocks without extra coding.

Drag Fill
Simplify data entry with Auto Drag Fill, which automatically populates similar or incremental values. Custom fill allows for programmatic data loading at runtime.

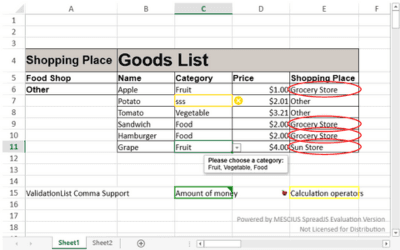
Data Validation
Data validation sets rules for cell entries and provides visual cues for invalid data, helping users correct inputs to meet database restrictions.
Auto Merging
SpreadJS enables AutoMerge for cell ranges, columns, and row/column headers, automatically merging neighboring cells when text matches.

Cell States
Define custom cell styles to indicate state changes (e.g., edit mode, hover, invalid, active, selected, read-only, changed) and create interactive input forms.

Hyperlinks
Enables Excel-like hyperlinks in JS worksheet cells, allowing quick access to sheet locations, URLs, draft emails, and custom commands that function as buttons.

Input Mask Style
StyleThe Input Mask Style enforces a specific format for data accuracy. SpreadJS offers customizable styles with user-defined patterns, placeholders, and masking characters.

Barcodes
SpreadJS supports eleven barcode sparklines, including QR code, EAN-13, EAN-8, and others, which can be applied to any cell via formulas.

Rich Text In Cells
The Basic Rich Text feature lets you use multiple text styles in one cell, highlighting key information with bold, italic, various fonts, and colors—all in one place for visually appealing spreadsheets.

Cell Formatting
SpreadJS offers extensive cell-level formatting options, including type, font, size, borders, colors, alignment, word wrap, indentation, padding, labels, orientation, validation, tags, and comments.

Cell Types
SpreadJS offers various cell types, allowing you to control the information entered and displayed in any cell. With the cellTypes namespace, you can define custom cell types or use predefined options like combo box, check box, buttons and more for easier data selection and validation. These versatile cell types help streamline data entry and ensure accuracy, making them ideal for applications that require structured data input.
Cell Drop-Downs
Effortlessly enhance data selection with SpreadJS cell drop-downs. Using the DropDownType enumeration, you can create interactive forms featuring lists, date pickers, sliders, calculators, color pickers and more, all tailored for precise data entry and streamlined user experiences. These customizable drop-downs make it easy to guide users through selecting and entering accurate information.
Range Templates
The Range cell type allows for custom data rendering by defining a template of cell ranges as a single CellType that can then load data into that cell template, enabling you to create views like card layouts, multi-row displays, or KPI blocks without extra coding. You can programmatically create Range template cells or design them visually using the SpreadJS Designer, streamlining the setup of dynamic and visually engaging layouts. This feature makes it easy to present complex data in an accessible, customized format.
Drag Fill
Simplify data entry with Drag Fill in SpreadJS, which allows users to automatically populate cells with similar or incremental values by simply dragging. Custom fill options enable programmatic data loading at runtime, making it easy to handle complex data population needs within your applications.
Data Validation
Data validation in SpreadJS allows developers to set restrictions on the data that can be entered in each cell, ensuring consistency and accuracy. Using the DataValidation namespace, you can define specific rules, such as numeric ranges or text length limits, and provide visual indicators to flag invalid entries. This helps users correct data entry to align with database requirements, maintaining data integrity throughout your application.
Auto Merging
SpreadJS enables AutoMerge for cell ranges, columns, and row/column headers, automatically merging neighboring cells when their text matches. Using the autoMerge method, you can easily configure this feature to streamline data presentation and improve readability by reducing repetitive content. Auto Merging is especially useful for organizing data in reports, tables, and summaries, helping users quickly interpret information.
Cell States
Define custom cell styles to visually indicate different state changes, such as edit mode, hover, invalid, active, selected, read-only, and changed states. Using the CellStatesType enumeration, you can easily configure these styles to enhance user interactions and create responsive, interactive input forms. This feature ensures that users can quickly identify the status of each cell, improving the overall user experience.
Hyperlinks
SpreadJS enables Excel-like hyperlinks in worksheet cells, allowing users to quickly navigate to specific sheet locations, open URLs, draft emails, or trigger custom commands that function as interactive buttons. Using the HyperLink class from the CellTypes namespace, you can easily configure and customize hyperlinks to enhance navigation and interactivity within your JavaScript applications, making it easier to connect and access related data.
Input Mask Style
The Input Mask Style in SpreadJS enforces specific data formats to ensure accuracy and consistency. With the InputMask namespace, you can create customizable input masks using user-defined patterns, placeholders, and masking characters, allowing precise control over how data is entered. This feature is ideal for scenarios that require structured data input, such as phone numbers, dates, and identification codes.
Barcodes
SpreadJS supports eleven types of barcode sparklines, including popular formats like QR code, EAN-13, EAN-8, and more, which can be easily embedded into any cell. Users can add a barcode to a JavaScript worksheet using a simple barcode formula, making it straightforward to generate scannable codes for various applications directly within the spreadsheet. This feature is ideal for inventory management, product labeling, and data encoding.
Rich Text In Cells
The Rich Text feature in SpreadJS allows users to apply multiple text styles within a single cell, letting you combine bold, italic, different fonts, and colors to highlight key information. This flexibility makes it easy to create visually appealing and well-organized spreadsheets. Using the ValueType enumeration, you can specify a cell's value type as richText to enable these enhanced formatting options, ensuring your data is both informative and aesthetically engaging.
Cell Formatting
SpreadJS offers extensive cell-level formatting options, including type, font, size, borders, colors, alignment, word wrap, indentation, padding, labels, orientation, validation, tags, and comments. You can easily apply and manage these formats using the setFormatter and getFormatter methods. Additionally, the formatter method allows you to get or set the formatter for specific cells, columns, or rows, providing flexibility and control over how data is displayed. These features help create well-organized, visually appealing spreadsheets that enhance data readability.
Charts
SpreadJS provides various chart types—line, bar, waterfall, combo, and more—for effective data visualization in JavaScript. Users can customize layouts and elements to analyze financial data, stock performance, and sales revenue.

Sparklines
Sparklines offer a compact visual representation of data trends, such as increases, decreases, minimums, maximums, stock levels, and costs, which can be embedded in any cell.

Conditional Formatting
Use conditional formatting to automatically highlight key information and spot trends in your data based on specified values.

Filtering
Use the built-in Excel-like filter dialog for users to easily filter data or create custom filters to display relevant information according to your application's needs.

Slicers
Excel-like slicers provide a visual method for filtering spreadsheet data, including options for tables, items, charts, aggregations, and custom slicers found on consumer websites.

Charts
SpreadJS provides a wide variety of chart types—such as line, bar, waterfall, combo, and more—offering effective data visualization for JavaScript applications. Users can customize chart layouts and elements, making it easy to analyze financial data, stock performance, sales revenue, and other key metrics. You can create charts using the ChartCollection's add method, specifying parameters like chart type, dimensions, and data range. For example, adding a clustered column chart can be done with a simple command, setting its position, size, and data source, allowing for flexible and dynamic visual representations.
Sparklines
SpreadJS offers sparklines, which provide a compact visual representation of data trends, such as increases, decreases, minimums, maximums, stock levels, and costs. These mini-charts can be embedded directly in any cell, offering a quick overview of data patterns. You can set the sparkline type to column, line, or win/loss using the setSparkline method, or use type-specific formulas to create various sparklines available in SpreadJS. Additionally, you can implement custom logic to define a unique sparkline formula based on your dataset and settings, and add it using the addSparklineEx method for more tailored visualizations.
Conditional Formatting
Use conditional formatting to automatically highlight key information and identify trends based on specified values. This feature helps you quickly spot patterns and outliers in your JavaScript spreadsheet data. Conditional formatting can be applied to worksheets through flexible conditional formatting rules, and SpreadJS supports importing and exporting many of Excel's rules for seamless integration. You can utilize the ConditionalFormatting namespace and ConditionalFormats class to access a variety of methods and enumeration options, enabling precise control over how your data is visually represented.
Filtering
SpreadJS offers an Excel-like filter dialog that lets users easily filter data or create custom filters to display relevant information. Conditional filters (number, text, date, color, and custom) can be set programmatically using the rowFilter method, with specific conditions added via addFilterItem method. Users can interact with filter options through a simple button in the column header, and customize dialog visibility to control sort and color filters. The dialog supports hierarchical lists and keyboard navigation, streamlining data management.
Slicers
SpreadJS offers Excel-like slicers, providing a visual and intuitive way to filter spreadsheet data. Users can easily apply filters to tables, Pivot Tables, items, charts, and aggregations, similar to the custom slicers often found on consumer websites. Slicers enhance data analysis by enabling quick, clear adjustments, making it easy to refine views and highlight relevant information directly within the spreadsheet.
Globalization
SpreadJS supports English, Chinese, and Japanese, and allows for custom resource files for other languages. Its calculation engine offers 18+ language packages and custom function localization.

Search
Easily search spreadsheets with advanced options like case sensitivity, exact matches, wildcards, and cell ranges. Search text, tags, or formulas using the search method.

Form Controls
Create complex, interactive data entry forms for JavaScript apps with controls like buttons, checkboxes, combo boxes, and more using the addFormControl function.

Context Menu
SpreadJS offers an Excel-like context menu for right-click interactions, allowing easy customization by adding or removing options.

TableSheet
TableSheet offers fast, data-bound table views with a grid-like UI and calculation engine. It uses Data Manager to fetch, interact, and bind server data for efficient analysis.

Data Manager
The SpreadJS Data Manager simplifies connecting to TableSheet's data, supporting remote sources like REST, OData, GraphQL, and local JSON, CSV, or XML.

Shapes
Includes supports for Excel shapes and advanced data-driven shapes, enabling dynamic creation of interactive visuals like manufacturing plant layouts.

Picture Shape
The Picture Shape feature in SpreadJS lets you insert, move, resize, and format images, enhancing the visual appeal of your spreadsheets and dashboards.
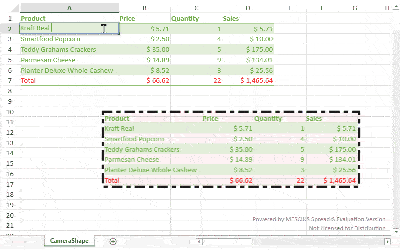
Camera Shape
The Camera shape provides an instantly updating view of a spreadsheet range, ideal for dashboards, and supports movement, resizing, rotation, grouping, and Excel I/O operations.
Floating Objects
Add custom floating objects like pictures, logos, or HTML content atop sheet cells. Customize interaction using various properties for a tailored experience.

Globalization
SpreadJS provides robust globalization support with the included 450 different culture infos which can be used through the SpreadJS globalization JavaScript library. Its calculation engine includes 18+ language packages, enabling users to localize custom functions and adapt their applications to different regions. Developers can use the CultureInfo class to manage culture-specific settings, ensuring seamless language integration and a localized experience for users worldwide.
Search
SpreadJS offers advanced search functionality, enabling users to easily locate content within spreadsheets. Use options like case sensitivity, exact matches, wildcards, and specific cell ranges to refine your search. You can search through text, tags, or formulas, making it simple to find relevant data. Developers can also use the search method with SearchCondition to implement custom search logic, providing precise control over how and where searches are performed within the workbook.
Form Controls
SpreadJS enables the creation of complex, interactive data entry forms for JavaScript applications, suitable for industries such as medical, legal, insurance, education, and finance. Using the Shapes namespace, developers can add new form controls to the shape collection with the addFormControl function. The FormControlType enumeration offers a variety of built-in controls, including buttons, spin buttons, list boxes, combo boxes, checkboxes, option buttons, and more. These form controls can be added to a worksheet or imported from existing Excel files, making it easy for users to interact with cell data.
Context Menu
SpreadJS provides an Excel-like context menu that enables right-click interactions for a seamless user experience. The context menu offers a range of standard options, such as cut, copy, paste, insert, delete, and formatting, allowing users to quickly perform common tasks. Developers can easily customize the menu by adding, removing, or rearranging menu items to suit specific application needs. Additionally, custom commands and options can be integrated, giving full control over the context menu functionality to enhance interactivity within spreadsheets.
TableSheet
SpreadJS's TableSheet enables efficient data management via a fast, data-bound DataTable view with grid-like behavior and a spreadsheet user interface, including support for structured formulas. It provides features such as sorting, filtering, and styling, making it easy to create interactive data grids for seamless data handling.
Using the TableSheet namespace, developers can integrate TableSheet functionality into their applications. A TableSheet can be created with the GC.Spread.Sheets.TableSheet.TableSheet and GC.Data.DataManager classes. The included relational Data Manager acts as a powerful local data engine, interacting with databases to fetch, manage, and sync real-time data, which is then bound to the TableSheet for smooth data manipulation and display.
Data Manager
The SpreadJS Data Manager is a high-performance data engine API that simplifies and accelerates connecting to and managing data within TableSheet. It serves as the data core of the application, allowing seamless interaction with data, including sorting, filtering, grouping, and aggregating. Using the GC.Data.DataManager class, developers can easily map tables and relationships with methods like addTable and addRelationship, or remove them as needed. The Data Manager synchronizes real-time data back to the database, supporting both remote sources (REST API, OData, GraphQL) and local sources (JSON arrays, CSV strings, XML), enabling flexible data management and integration for TableSheet.
Shapes
SpreadJS includes support for many Excel shapes and offers advanced functionality with data-driven shapes, enabling the dynamic generation of interactive elements. These shapes can be used to create complex visualizations, such as a manufacturing plant floor layout, that update based on real-time data. Developers can use the add method from the ShapeCollection class to easily insert custom shapes into worksheets, providing flexible and interactive design options for data presentation.
Picture Shape
The Picture Shape feature in SpreadJS allows you to insert, move, resize, and format images within spreadsheets, enhancing the visual appeal of documents and dashboards. SpreadJS supports adding pictures as shapes, making it easy to interact with and customize images. The picture object is created using the ShapeBase class, inheriting properties that allow for seamless formatting and interaction with other shapes. You can add a picture shape using the addPictureShape method, which accepts parameters such as name, source, location (x and y), and size (width and height), providing flexible control over image placement and appearance.
Camera Shape
The Camera Shape feature in SpreadJS provides an instantly updating snapshot view of a specified spreadsheet range, making it ideal for dynamic dashboards. Users can move, resize, rotate, group, and even interact with Excel I/O operations for the Camera Shape, ensuring seamless integration into various layouts. The addCameraShape method from the ShapeCollection class allows developers to easily insert Camera Shapes, while the CameraShape API enables customization of the style and behavior. This feature is perfect for creating real-time visual snapshots of data that automatically refresh as the source data changes.
Floating Object
SpreadJS allows you to add custom floating objects, such as pictures, logos, or custom HTML content, that display on top of the cells within a sheet. These objects can be customized using various properties to control their appearance and interaction, making them versatile for adding visual elements like branding or interactive widgets. The add method of the FloatingObjectCollection class enables developers to easily insert floating objects, specifying parameters like name, position, and size for precise control over how they appear on the sheet.
Designer Ribbon Component
Provides a familiar UI with a ribbon, formula bar, status bar, side panels, and context menus. Fully customizable ribbon for tailored spreadsheet experiences in JavaScript apps.

Pivot Tables
Optional support to enable Pivot Tables, including import/export of Excel Pivot Tables. Features Pivot Panel, Slicers, and context menus for efficient data grouping and analysis.

Gantt Chart Sheet
SpreadJS offers an optional Gantt Chart Sheet add-on with a data-bound DataTable and spreadsheet UI. Features include Timescales, Taskbars, Tasks, Calendar, and more.

ReportSheet
SpreadJS offers ReportSheet, an optional add-on for quick report creation within JavaScript apps. It supports report design with data entry, pagination, filtering, sorting, and conditional formatting.

DataCharts
Create advanced charts bound to SpreadJS' Data Manager; allowing developers to host charts as floating objects or integrate with template cells for dynamic visuals.

AI-Assistant
Add natural language intelligence to your JavaScript spreadsheets with the AI Assistant add-on. Enabling user-enter natural language formula creation, formula explanation, and PivotTable layout generation or analysis through simple text prompts.

Collaboration Server
Enable real-time, multi-user spreadsheet editing with the SpreadJS Collaboration Server. Built on a flexible OT-based framework, it synchronizes changes instantly, tracks user presence, and enforces permissions for secure, scalable collaboration.

Designer Ribbon Component
The SpreadJS Designer Ribbon Component is an optional add-on package that brings the familiar UI elements of the Desktop Spreadsheet Designer to JavaScript applications. It offers a fully customizable ribbon bar, formula bar, status bar, side panels, and context menus, enabling end-users to easily interact with and customize spreadsheets directly within their apps. Developers can modify, extend, or rearrange components by adjusting the configuration file, allowing complete control over the UI.
Pivot Table
SpreadJS offers the optional Pivot Table add-on, enabling users to efficiently group, calculate, and summarize large data sets within JavaScript applications. Users can import and export Excel Pivot Tables, making it easy to integrate existing reports or share data summaries. The Pivot Table add-on includes features like the Pivot Panel, Pivot Slicers, and context menus, allowing for intuitive data organization and dynamic, interactive analysis. With a familiar UI, users can quickly create reports, discover trends, and visualize complex data, improving business intelligence. Developers can fully customize the Pivot Table experience to suit their application's needs, leveraging built-in aggregations, field lists, and calculated fields.
Gantt Chart Sheet
SpreadJS offers an optional JavaScript Gantt Chart Sheet add-on that brings powerful Gantt chart functionality to your applications. This add-on uses the included fast, data-bound DataTable with a familiar spreadsheet user interface, making it easy to manage project timelines and tasks. It includes standard Gantt features such as timescales, taskbars, task dependencies, and calendar capabilities, enabling efficient project planning and tracking. The Gantt Chart Sheet is ideal for visualizing schedules, managing resources, and monitoring project progress within a JavaScript environment.
ReportSheet
SpreadJS offers the ReportSheet, an optional add-on for quick and easy report creation within JavaScript spreadsheet applications. This new sheet type allows users to design reports that include data entry, pagination, data filtering, sorting, and conditional formatting. The add-on consists of two components: ReportSheet and TemplateSheet, with TemplateSheet offering various report-related settings for customization. Connected to a DataManager implementation, ReportSheet provides data entry APIs for seamless interaction. Users can design reports directly in the optional SpreadJS Designer Ribbon Component, gaining full control over the report UI, which can then be exported and integrated into any SpreadJS instance.
DataCharts
The DataCharts Add-On is a powerful tool for advanced data visualization within JavaScript spreadsheet applications. This add-on allows users to create charts bound directly to SpreadJS’ TableSheet and Data Manager, overcoming the limitations of traditional Excel-style charts in SpreadJS. Charts can be designed as floating objects or seamlessly integrated into worksheet templates.
The DataCharts Add-On includes a flexible API for managing chart instances, including adding, removing, and configuring charts. Users can define chart configurations using a subset of DV options, ensuring full customization and dynamic data binding. For ReportSheet Add-On users, the add-on integrates effortlessly, enabling template-based chart designs that adapt to data-driven layouts. With this tool, SpreadJS expands its capabilities, delivering unparalleled flexibility for interactive charting in modern applications.
AI-Assistant
The SpreadJS AI-Assistant add-on brings natural language intelligence directly into your JavaScript spreadsheet applications, allowing users to generate formulas, explain complex logic, translate content, analyze sentiment, or interpret data using simple written instructions.
Integrated into both SpreadJS and the Designer, it enhances the Formula Editor Panel with AI-powered formula creation and step-by-step explanations, while providing worksheet functions like SJS.AI.QUERY, SJS.AI.TRANSLATE, and SJS.AI.TEXTSENTIMENT for advanced, AI-driven data processing.
The add-on also extends the PivotTable Panel Add-On with smart layout generation and AI-assisted data analysis. Users can describe the PivotTable structure they want or ask analytical questions about existing PivotTable data, receiving immediate layouts, recommendations, or insights without manual configuration. This feature streamlines complex spreadsheet tasks, accelerates productivity, and makes advanced analysis accessible to every user in your application.
Collaboration Server
The SpreadJS Collaboration Server add-on provides the real-time synchronization layer your enterprise applications need for multi-user spreadsheet editing. Powered by a modular Collaboration Framework—including communication, presence, and OT (Operational Transformation) engines—it ensures every edit, selection change, and structural update remains consistent across all connected clients.
Through the SpreadJS Sheets Collaboration components, the server captures workbook changes, converts them into operations, processes them through OT Reducer/Transform logic, and broadcasts them to all active sessions. This enables features such as simultaneous editing, live selection highlighting, user presence indicators, and granular permission control (view-only vs. edit). Developers can also extend the framework to support custom workflows like version history, user management, or multi-view single-user scenarios. The Collaboration Server delivers robust, real-time coauthoring capabilities without requiring you to build synchronization logic from scratch.
Build Your Own JavaScript Spreadsheet
| Quick Start Guide | |
|---|---|
1. Download the Latest SpreadJS Release or get it from npm | Download Full Trial npm install @mescius/spread-sheets |
2. Include the SpreadJS script and CSS files in the documents Head section. Replace “XX.X.X” with the release version downloaded. | <head> <script src="gc.spread.sheets.all.xx.x.x.min.js"> <link rel="stylesheet" href="gc.spread.sheets.xx.x.x.css"type="text/css"/> </head> |
3. Add a DIV container to host the JavaScript spreadsheet instance.
| <div id="ss"></div>
|
4. Initialize the JavaScript spreadsheet | var workbook = new GC.Spread.Sheets.Workbook(document.getElementById('ss')); |
Learn more with our complete quick start guide for SpreadJS.
The Leading JavaScript Spreadsheet Library
Easy Licensing & Distribution
Generate Distribution Key/s for Your SpreadJS Applications via Your MESCIUS Account After Purchase
Licensing FAQs
SpreadJS is licensed per developer and deployed hostname. Hostname deployment licenses vary depending on whether the deployment is commercial or non-commercial.
Request a Trial Key
Our sales team can provide 30-day trial Distribution Keys for SpreadJS and the optional add-ons upon request, allowing you to deploy SpreadJS during your trial period.
Have Questions? We're Here to Help
Email eu.sales@mescius.com to schedule a call with our product specialists or request a personalized demo through support to discuss your project needs.

What's New in SpreadJS v19
SpreadJS v19 is available! This release offers several new enhancements and features to its JavaScript spreadsheet component and new optional add-ons, including:
NEW! AI Assistant Add-On – Natural-language formulas, AI PivotTables, and AI cell functions
NEW! Collaboration Server Add-On – Real-time, multi-user editing with OT engine and permissions
UI/UX Improvements – Threaded comments, justify alignment, header-aware sorting, bulk deletion
calcWorker Web Worker Plugin – Faster, smoother calculations
New DataCharts Add-On Types – New financial and multi-series charts
PivotTable Add-On Enhancements – Grouping, custom sorting, and protected-sheet support
ReportSheet Add-On Enhancements – Smarter layouts, pagination, and Excel-friendly output
Framework Updates – Support for Angular 20 and Nuxt.js 4
Featured Blogs, Videos, and Other Resources


Award-Winning Products and First-Class Support

"I have been using a various form of Spread back to the COM days. Spread is the most reliable spreadsheet that retrieves and stores data, whether interacting with a database or simply an Excel file. Try it out, and you will not go back to any other control"
TRUSTED CUSTOMER
"Great support through evaluation process, Spread is my favorite development add-in, adds great, high value capabilities to applications!"
TRUSTED CUSTOMER
"Excellent Products. I have been using their products for around 15 years. Always there to help."
TRUSTED CUSTOMER